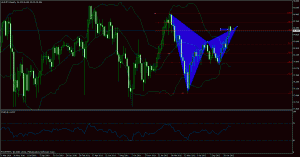
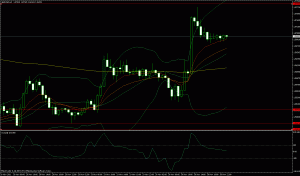
Couple days ago I suggested a good chance to short AUDJPY because of RSI Diverge. right now making some profit, but I just found that actually a Gartley Pattern is found on the weekly chart… so most likely can go down more… my first target is 84.5…
Forex
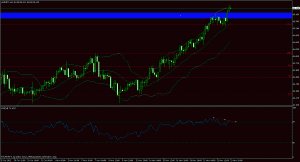
AUDJPY H4 RSI showing Divergence
This is H4 chart for AUDJPY. it shows divergence on RSI. Also, RSI above 70 indicated overbought. Most likely it will correct soon. Selling it has pretty good chance to win.
NZD/USD sell Opportunity?
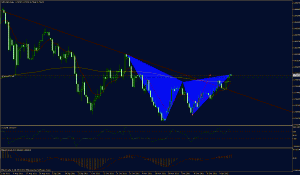
Daily Chart NZD/USD. Although it has broken the down trend channel, but it is also forming a Gartley Pattern, and now it is around a daily resistance zone. Not sure, but look good to sell for me. Stop-Loss probably 0.808, and go for 0.78. will see in next couple days. 🙂
Bad Luck?
The Forex market was very volatility yesterday. In 5 min, some pairs just surged 200-300 pips because of the news. Wow, too bad that none of my order got executed in my favor positions. 🙁 I guess sometime luck is very important.. some pairs only need 5-10 pips more to reach my orders before it surged, or got Stopped even if they got executed. Damn! That kind of shit happened always got me feeling of bad luck! But It just won’t let me down!!! opportunity is everywhere on Forex market! haha!
Here are two trades. One not reached, and one got stopped.
I set my order for AUD/USD at 1.33295. Somehow although the chart price reached, it just did not execute! (Should I blame on FXCM?) My target was just 1.22, and my SL is 1.305. That is about 1:4 Risk Ratio. Too bad.
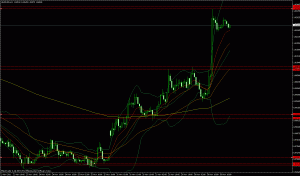
GBP/USD got executed, but unfortunately it stopped me before going back down. My Stop Loss was 1.5776.. I think the Highest was 1.5778…felt like been stop hunted… so I was very bad luck… haha. My target was 1.5650. it hasn’t reached yet. It looks like a bullish flag pattern now, but I guess it probably will go down since the other resistance zone is just about 1.578.
