表妹帶來的,雖然在我手中,但也吃不了>_
Insight
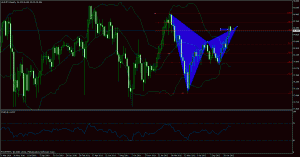
AUDJPY Gartley Pattern on Weekly Chart
Couple days ago I suggested a good chance to short AUDJPY because of RSI Diverge. right now making some profit, but I just found that actually a Gartley Pattern is found on the weekly chart… so most likely can go down more… my first target is 84.5…
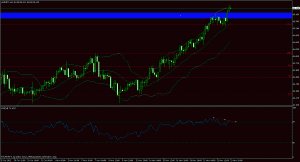
HSI again
Couple weeks ago, I mentioned HSI was in a Heavy Selling zone, but it still broke 21800 and stayed above. Since I think it has broken that selling zone, HSI should be able to reach 23000. However, I still think the best time to long it is when it drops back to 20000..
Disclaimer: This is just my study for HSI chart, not an advise to anyone. 🙂
AUDJPY H4 RSI showing Divergence
This is H4 chart for AUDJPY. it shows divergence on RSI. Also, RSI above 70 indicated overbought. Most likely it will correct soon. Selling it has pretty good chance to win.


